8 June 2026 · 13 min read
How to Read a Leaflet Distribution Completion Report
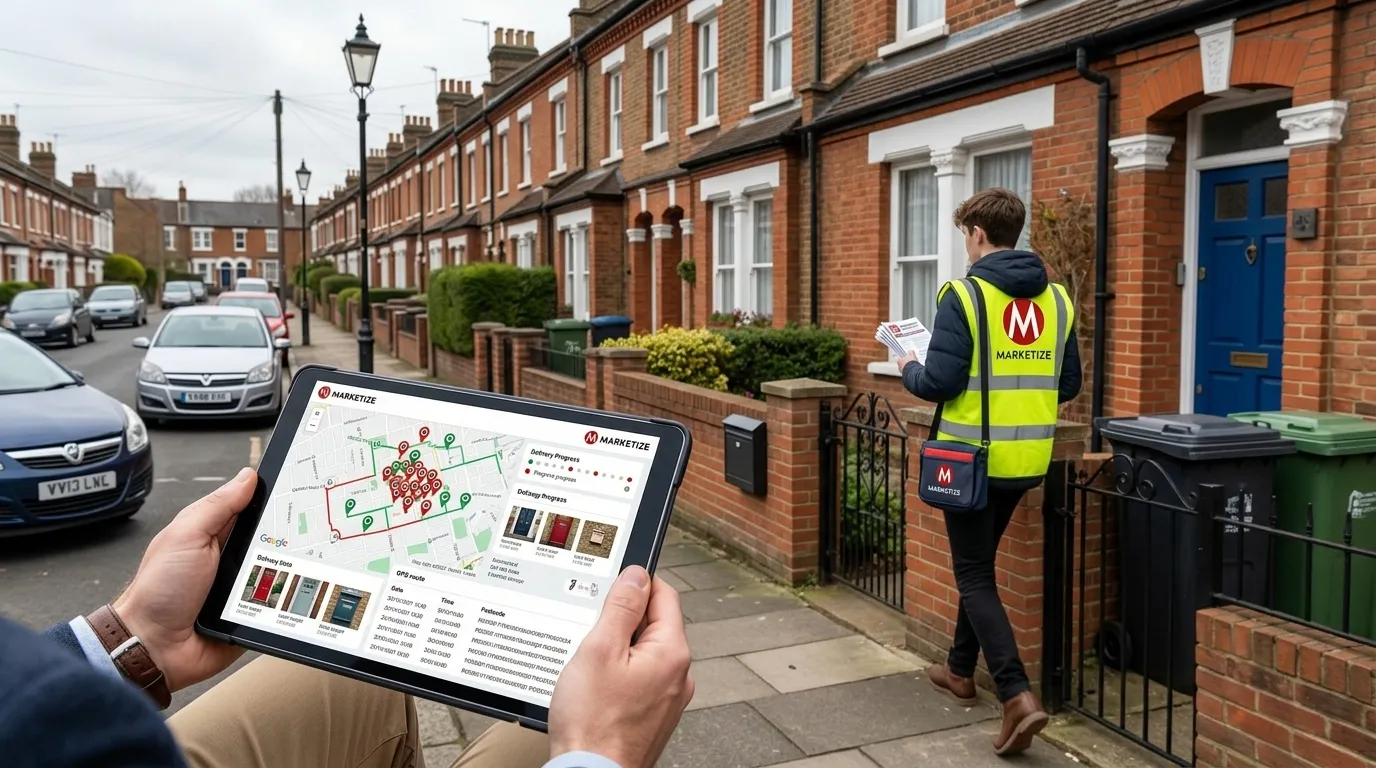
A completion report is supposed to answer one question: did the work get done? In practice, most leaflet distribution completion reports answer a different question entirely - namely, does this look like the kind of document a company that did the work would produce?
These are not the same question. And the gap between them is where a significant amount of client money disappears.
The completion report has become, for a portion of the leaflet delivery service industry, one of the primary tools for managing what clients believe about a campaign rather than informing them about what actually happened. Twelve pages with maps, timestamps, photographs, and aggregate statistics creates a powerful impression of thoroughness. But unless you know what specific data to look for - and what questions the report should be able to answer - volume of information is no substitute for verifiable evidence.
This article is part of the client's guide to not getting burned series. The previous article - why leaflet distribution companies are confident when things go wrong - covered the techniques used to manage client concerns rather than resolve them. This one focuses specifically on the completion report: what a genuine one contains, what most don't include, and the specific questions you should be asking when you receive one.
The Problem With Most Completion Reports
Most door to door leaflet distribution completion reports are structured to communicate confidence, not to communicate evidence. They tend to contain some version of the following: a coverage map showing the agreed campaign area, a GPS trail overlaid on that map, start and end timestamps, a summary of quantities delivered, and a selection of photographs.
This looks substantial. For a client who doesn't know what to scrutinise, it can look conclusive. But examine each component and you'll find that none of them, individually or in aggregate, actually tells you what percentage of households in your target area received a leaflet.
Take the coverage map. A map that shows a GPS trail covering the agreed area confirms that a device travelled through that area. It does not confirm that leaflets were being carried. It does not confirm that leaflets were posted through letterboxes rather than returned at the end of the day. It doesn't tell you whether the pace of movement through that area was consistent with someone delivering to each property, or someone walking quickly through without stopping. The map covers the geography. It doesn't evidence the delivery. For the full technical breakdown of what GPS tracked leaflet delivery actually captures - coordinates, timestamps, offline storage, photo metadata - that guide covers every element.
Take the photographs. A handful of photographs taken at the beginning of the first day's distribution shows a distributor at work. It does not show continuous progress throughout the route. Photographs taken at the start of a shift and produced as evidence of the whole campaign are not evidence of the whole campaign - they are evidence of how it started. The question is what happened after the photographs stopped.
Take the aggregate delivery statistics. A figure saying "9,750 leaflets delivered across the target area" tells you what the distributor reported as the delivered quantity. It doesn't tell you how that figure was arrived at, how it was cross-referenced against anything, or whether the non-delivery allowance - typically five to ten percent across most residential areas, accounting for "No Junk Mail" signs, inaccessible properties, and genuine access barriers - was legitimately recorded or simply used to make the maths work. The specific fraud tactics that aggregate statistics are designed to obscure are catalogued in how to prevent dishonest leaflet distributors.
None of this means the campaign was poorly delivered. It means the report, as typically structured, doesn't give you a basis for knowing either way.
What a Genuine Completion Report Contains
A completion report that provides actual accountability has specific characteristics. Not more pages, not more professional formatting - specific data points that are both harder to fabricate and directly responsive to the question of whether delivery happened.
Street-Level GPS Coverage
The GPS trail should be visible at street level, not just as a general coverage map. You should be able to zoom in to any area within your campaign zone and see the specific streets the distributor walked. If a particular road or estate is missing from the trail, that gap should be visible and explicable.
More importantly, the trail should show movement data that is consistent with delivery. A distributor posting leaflets through letterboxes on a dense residential street moves at a certain pace - slower than walking without stopping, with a distinct rhythm of movement toward each property. GPS data that shows someone walking unusually quickly through an area, or that shows consistent movement along the centre of roads without the deviations toward individual properties, is not the same data as someone delivering.
Pace analysis - comparing the time spent in each section of the route against the known letterbox density of that area - is the layer of verification that makes GPS data genuinely meaningful. Without it, a GPS trail is easier to manipulate than it appears. For the full analytical framework that turns GPS coverage data into pace-based delivery verification, how to use GPS tracking for campaign analysis covers every element.
A Non-Delivery Log With Specific Addresses
A genuine non-delivery log lists individual addresses where delivery was not possible, with a recorded reason for each one. Not an aggregate figure. Not a percentage. Specific properties.
The reasons that constitute a legitimate non-delivery are real and documented: a clearly displayed "No Junk Mail" sign, an aggressive or audible animal behind the door, a genuinely inaccessible gated property, a confrontational resident, a physical safety hazard on the approach. A log that contains specific addresses and specific reasons for each is something a client can review, query, and - if necessary - independently verify. An aggregate figure saying "approximately 8% non-delivery" is not.
The log should also have been created in real time, at each address, not retrospectively at the end of the shift. The difference matters because a real-time log is timestamped to the location where it was recorded. A retrospective log can be constructed to match whatever figure is convenient. For the full picture of how this kind of evidence sits within the broader fraud-prevention framework, how to avoid leaflet theft and false delivery claims covers every tactic and countermeasure.
Geotagged Photographs Throughout the Route
Photographs included in a completion report should be geotagged - meaning they contain embedded location data showing where they were taken - and they should be distributed throughout the route, not clustered at the beginning.
If a report contains twenty photographs, all taken within the first two hours of a six-hour distribution shift, and none from the remainder of the route, that tells you something. The photographs show that delivery was happening at the start. They provide no evidence about what happened afterward.
A genuine photo log has images from multiple points across the route, at intervals that roughly correspond to the progression of the delivery. The embedded geotag coordinates should match the GPS trail at the time the photograph was taken. When photos appear as pins on a map at their precise capture coordinates, you can see whether the visual evidence is distributed across the whole delivery area or concentrated in one section of it. Real time delivery tracking with offline data storage - covered in detail in the technology behind modern leaflet distribution - is what makes this kind of continuous photo distribution practical even in areas with patchy mobile signal.
Cross-Referenced Coverage vs Letterbox Count
A completion report that contains genuine accountability will show you the relationship between the GPS trail and the number of deliverable addresses in the area covered. Letterbox counting tools cross-reference route coverage against address data to produce an estimate of deliverable properties within the area walked.
If a distributor walked streets containing an estimated 9,000 deliverable letterboxes, returned 450 as genuinely undeliverable (a five percent non-delivery rate), and claims 8,550 deliveries - the numbers should be consistent. A completion report that presents claimed delivery volume without any cross-reference to the known letterbox density of the area covered can't be verified. The figure is simply asserted.
The Questions Every Completion Report Should Be Able to Answer
When you receive a completion report, there are five questions it should be able to answer directly from the data it contains. If it can't answer these questions, it isn't telling you what you need to know.
- Can you see, at street level, which specific roads were covered and which weren't? Not just that the area was covered - which specific streets.
- What was the non-delivery rate, and which specific addresses are listed as undeliverable? If the report can only give you an aggregate percentage, it doesn't have address-level records.
- Where were the photographs taken, and when? Are they distributed across the route, or do they come from the first part of the shift?
- Was the pace of movement through each section consistent with delivery? Can you see the movement data rather than just the route taken?
- If you raise a concern about a specific street or area, can the company point you directly to what the data shows for that location? Or does the response involve general explanations about area characteristics?
A company with genuine completion data can answer all five questions by pointing you at the report. A company without it will answer by redirecting the conversation. For comprehensive context on what response rates each verified completion should produce - and what realistic ROI benchmarks look like - what is a good leaflet ROI gives you the industry data to evaluate results against.
What the Report Doesn't Prove
Even a thorough completion report with all the elements above doesn't prove, in an absolute sense, that every leaflet reached every letterbox. That level of certainty isn't achievable through any reporting mechanism. What it does is make the evidence difficult to fabricate and easy to interrogate.
GPS data that is timestamped, cross-referenced with letterbox density, and accompanied by geotagged photographs distributed throughout a route is not impossible to manipulate. But doing so requires significant effort and produces a record that, when examined closely, tends to show inconsistencies. The gaps and anomalies that characterise partial delivery become visible. The clustering of photographs at the start of a route becomes obvious when compared to a trail that covers the whole area.
The honest truth is that no piece of evidence proves a negative - you cannot prove with absolute certainty that a distributor didn't discard any leaflets. What you can do is make discarding or partial delivery inconsistent with the available data. When every non-delivery is logged with a timestamp and coordinates, when pace data is visible across the full route, when photos show continuous progress rather than a single session of evidence-gathering, the gap between what was done and what the data shows becomes very small. Small enough that the questions worth asking are about specific anomalies, not about whether the delivery happened at all.
What to Do If the Report Doesn't Hold Up
If you review a completion report and find that it doesn't answer the five questions above - or that specific concerns you raise are met with general explanations rather than direct references to data - you have a few options.
The first is to raise a specific, evidenced question. Not "why was the response rate low?" but "can you show me the GPS trail for [specific street] and what the non-delivery log shows for that area?" The response to a targeted, data-specific question is more informative than any general conversation about how the campaign went. The broader framework for matching response data against verified delivery - and identifying which specific anomalies are worth pursuing - is covered in how to measure leaflet campaign performance.
The second is to use an escrow-based payment process from the outset - one where the completion report is reviewed before payment releases, and where you have a defined window to raise concerns against the data before funds are transferred. Escrow payment changes the dynamic entirely: a company that hasn't delivered the work hasn't been paid for it yet, which means the report has to stand up to scrutiny rather than arriving after the invoice has already been settled. The full mechanics of how escrow-linked payment systems work - and why the upfront-payment industry norm has persisted - are covered in payment systems for leaflet distribution teams.
The third is to commission your next campaign through a platform that generates the data described above automatically - where GPS records, non-delivery logs, and geotagged photos are created by the system rather than assembled by the company delivering the report. When the evidence is system-generated and visible to you directly, it removes any opportunity for it to be shaped before it reaches you. For a comparison of which leaflet delivery tracking apps and platforms actually provide each element of a genuine completion report - street-level GPS, address-level non-delivery logs, geotagged route photos, and letterbox cross-referencing - that guide gives you a structured way to evaluate any platform's verification claims.
Professional Doesn't Mean Honest
A completion report that looks professional is not the same as a completion report that is honest. The difference is whether the data in it can be interrogated - whether a specific question about a specific street produces a direct answer from the evidence, or produces a confident, adjacent explanation. Knowing what to look for is the most effective protection you have, and it costs nothing to ask the right questions before you're looking at a report you're already not sure about.
This article focused on completion reports specifically. For the full strategic context - why leaflet distribution in 2026 is being reshaped by GPS verification, escrow payment, and platform-based accountability, and how that's closing the gap between physical and digital marketing measurability - that guide covers the broader landscape. And for the framework that ties completion data into campaign-level planning decisions, how to plan a successful leaflet campaign walks through every stage from objective-setting through to verified completion.
Ready to commission a campaign where the completion report can be interrogated from day one? View campaigns on Marketize - street-level GPS coverage, address-level non-delivery logs, geotagged photos distributed across the route, and letterbox count cross-referencing are included as standard, generated by the system rather than assembled afterward.