27 July 2026 · 11 min read
Why Large Brands Are Easier to Shortchange Than Small Business Owners in Leaflet Distribution
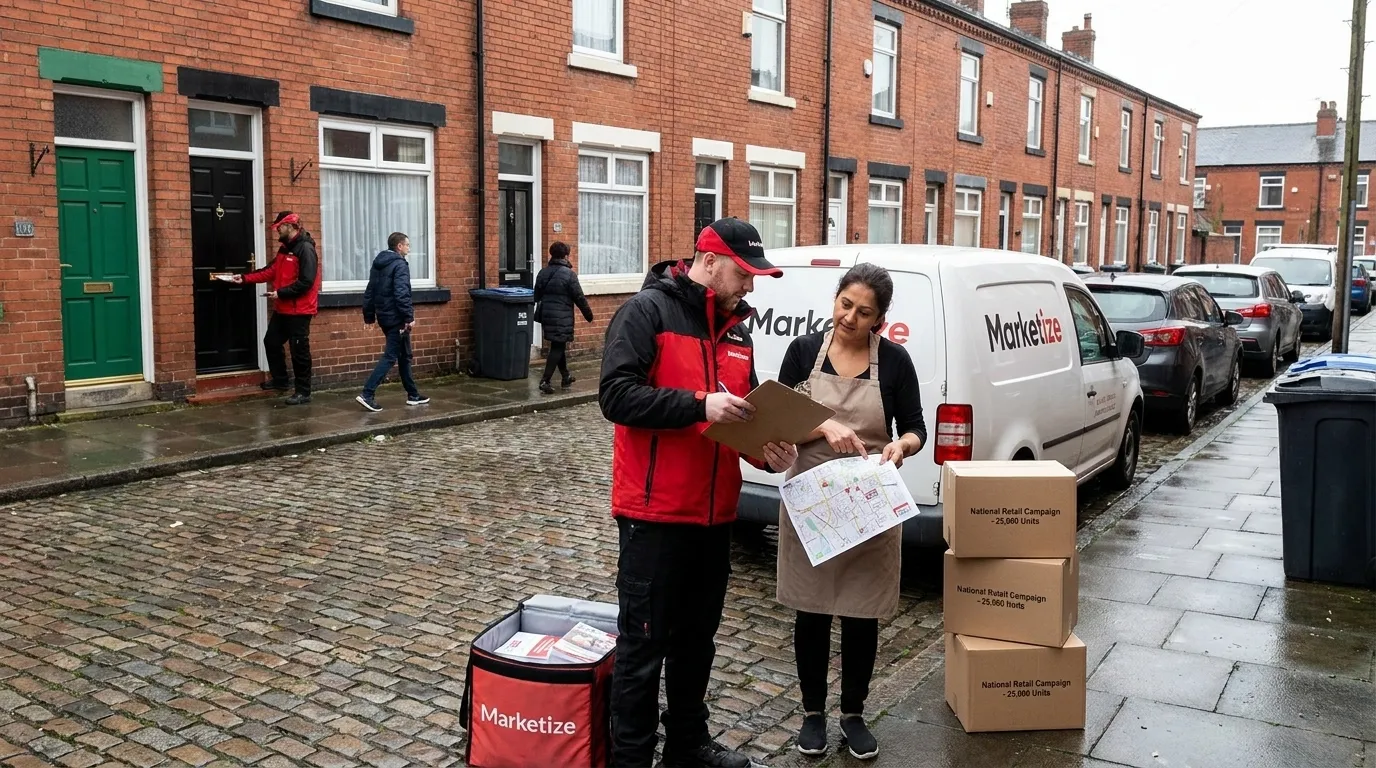
It seems like it should work the other way around. A national brand with a marketing department, a campaign budget running into six figures, and professional procurement processes ought to be harder to shortchange than a local takeaway owner spending £300 on their first leaflet distribution campaign. Bigger clients mean more sophistication, more oversight, more scrutiny - or so the logic goes.
In practice, the opposite is consistently true. And understanding why is important whether you're building a distribution operation that handles national accounts, managing campaigns for large clients, or trying to understand why the corporate work you're doing for bigger brands produces more friction and less clarity than your smaller client relationships.
The reason isn't that large organisations are naive. It's structural. And the structure that makes large brands vulnerable is the same structure that makes national campaigns difficult to run well: distance, aggregation, and the absence of the personal stake that makes small business owners such attentive clients. This article is the third in the national scale leaflet distribution series - which covers the operational realities of multi-region campaigns that most national distribution companies won't explain. The previous articles covered the intermediary chain: how briefs degrade and why national campaigns fail more than local ones.
The Personal Stake Problem
A local business owner running a leaflet campaign has something a national brand's marketing team doesn't: a direct personal stake in whether it works.
They spent money they noticed spending. They know the area - they work there, they live nearby, they have relationships with people who received or didn't receive the leaflet. When the campaign runs and produces nothing, they feel it immediately. They notice. They investigate. If a colleague drives past a street that was supposed to be covered and it looks untouched, they say something.
The feedback loop is short, personal, and driven by someone who cannot comfortably attribute a wasted £300 to "market conditions."
A national brand's door to door leaflet distribution campaign is managed by a marketing or operations professional running multiple projects simultaneously. The leaflet campaign is one line item in a broader activity plan. Their success metric is aggregate response rate across thirty or forty regions, not whether a specific postcode in Bristol produced an enquiry. They're measuring from a distance, through reporting structures, against benchmarks that average out a great deal of variation.
When the campaign generates some response - even significantly below what full delivery would have produced - the result is filed as a moderate performance. Not a failure. Not something to investigate. A data point in a larger picture that gets discussed in a quarterly review.
The business owner who gets nothing asks immediate questions. The marketing manager who gets something less than expected produces a report about it and waits to see whether the trend continues.
The Local Knowledge Advantage of Small Clients
Local knowledge is a form of accountability that scale eliminates.
A small business owner knows their area. They know whether a particular street tends to respond to offers. They know approximately how many letterboxes a specific residential road contains. They may well know people on the streets that were supposed to be covered. They have an instinctive sense of what their campaign area looks like, which means they have an instinctive sense of whether coverage seems right.
This knowledge creates a verification mechanism that operates without any technology. The client is, in effect, a spot-check on the campaign by virtue of living and working in the area they're targeting.
A national brand's marketing team has no equivalent. They're managing campaigns in thirty areas they don't know personally. Their only window into what happened is the completion report - which may have been assembled by parties with their own interest in how it reads. For a detailed breakdown of what a genuine completion report must contain versus what assembled summaries typically include, how to read a leaflet distribution completion report covers every element.
The absence of local knowledge doesn't just reduce the client's ability to catch problems. It reduces their ability to ask useful questions. A client who doesn't know that a specific estate in their campaign area has significant access complications can't ask why the non-delivery log for that area is higher than expected, because they didn't know to expect anything specific. The question simply doesn't occur to them.
The Aggregation Effect on Visibility
Scale aggregates data in ways that make individual failures invisible.
A small business running a 10,000-leaflet campaign in one area receives one set of results. If the response rate is lower than expected, there's nothing to average it against. The result is what it is, and it's visible in full.
A national brand running 1.5 million leaflets across thirty regions receives aggregated results. Regional performance is summarised into an overall picture. The regions where delivery was completed properly produce stronger response. The regions where peripheral areas were thinly covered or skipped produce weaker response. Averaged together, these produce an overall result that may look like a modest but acceptable performance, rather than revealing that several regions performed very differently from others.
The client sees an average. They don't see the distribution of results across the thirty regions. They don't know that six regions produced strong response consistent with full delivery, while fourteen produced mediocre response consistent with peripheral under-delivery, while the remaining ten produced something in between.
This is not accidental. Aggregate reporting is the format that has developed in national campaign management precisely because it is the format in which variation is least visible. And it is the variation - the difference between regions where delivery happened properly and regions where it didn't - that represents the gap between what the client paid for and what they received. The analytics framework that makes this variation visible - and distinguishes delivery failure from medium failure - is covered in how to measure leaflet campaign performance, with data-driven leaflet distribution methods covering how to build regional response comparison into ongoing campaign planning.
The Complaint Asymmetry
When a small business has a complaint about their leaflet delivery service campaign, they raise it directly with the person or company they dealt with. The relationship is personal. The complaint is specific. The expectation is resolution.
National brand complaints travel through the same chain as the brief - up from the marketing team to their account manager at the national distribution company, who has a prepared response ready, who is practised at deflecting concerns with confident explanations about market variation, and who holds the evidential authority in the relationship because they control the completion data.
The national distribution company controls the narrative. They have the data - or rather, they have the summary of the data, assembled from the chain that ran the campaign. The marketing manager has aggregate response figures and a vague sense that performance didn't match expectations. Against a detailed completion report and confident expertise, vague expectations don't build a sustainable complaint.
This asymmetry - the client raising a concern they can't fully evidence, and the supplier responding with authority and a summary that doesn't quite answer the question - is the same pattern documented in why leaflet distribution companies are confident when things go wrong and what managing the client really means in the leaflet distribution industry. At national scale, the techniques operate with even more authority than at local level, because the client is even further from the primary evidence.
The Scale of the Vulnerability
It's worth putting concrete numbers on what this vulnerability costs.
Consider a national campaign distributed to 1.5 million households across thirty regions. Assume a model where the peripheral thirty percent of each region - the harder-to-reach streets, the areas requiring more transit time, the estates with more access complications - is routinely under-delivered, either thinly or not at all.
The effective delivery is somewhere around one million to 1.1 million households rather than the 1.5 million paid for. The gap is 400,000 to 500,000 households. Print costs for those leaflets have already been spent. Distribution costs, or most of them, have also been paid. The only saving from the shortfall is the actual delivery time and effort for those peripheral areas - which is precisely where the margin sits in the model that describes this kind of campaign.
The response data the client receives is drawn from the households that were actually reached. But their cost-per-response calculation is indexed to 1.5 million households. Their assessment of regional performance variation is indexed to uniform delivery that didn't actually happen. And their decisions about future campaigns - whether to scale up, which regions to focus on, whether the channel is worth continuing - are built on a foundation that has been systematically tilted. For context on what genuine response rates and ROI look like when delivery is complete - so you can identify when a national campaign's figures don't match what full delivery should have produced - what is a good leaflet ROI gives you the benchmarks by business type and campaign scale.
A small business whose 10,000-leaflet campaign was delivered incompletely loses, perhaps, a few hundred pounds and an opportunity. A national brand absorbing this pattern across six figures of campaign spend, over multiple campaigns, making strategic decisions about an entire marketing channel based on data that doesn't accurately reflect what happened - the loss is of an entirely different order.
What the Pattern Means for Distribution Operators
If you're operating a distribution business that handles or wants to handle national accounts, this dynamic has direct implications for how you should think about the service you offer.
The vulnerability of large clients isn't something to exploit - it's something to close. A distribution operation that builds its national service around direct briefing, verified GPS proof of delivery coverage per region, and completion reports that give the client primary data rather than a compiled summary is offering something genuinely different from what the standard national account structure provides. For the technical foundation of what that primary data looks like - coordinates, timestamps, photo metadata, pace analysis - what is GPS tracked leaflet delivery covers every element. And for the analytical layer that lets regional performance be compared region-by-region rather than averaged into a single headline figure, GPS tracking for campaign analysis covers the framework.
That difference is most visible when something goes wrong. Not because it's a crisis management tool, but because a client who can see the primary data themselves - who can look at coverage by region, non-delivery rates by area, and pace analysis for specific sections - doesn't need to be managed through a complaint. They can see what happened. The conversation is between the client and the evidence, rather than between the client and someone who controls access to the evidence.
This is also the difference that large clients are, increasingly, asking for. Corporate marketing teams that have experienced the pattern described above - the confident explanations, the aggregate reports, the goodwill gestures that don't quite answer the question they asked - are looking for a service where the evidence is genuinely theirs, not assembled for them by the party that generated it. The commissioning framework that builds these structural protections in from the start is covered in how to commission a leaflet campaign so poor delivery has nowhere to hide.
Closing the Structural Gap
Large brands are easier to shortchange in leaflet distribution not because anyone planned it that way, but because the structural conditions of national campaigns - distance, aggregation, intermediary chains, and the absence of local knowledge - remove all the natural accountability mechanisms that protect small clients.
The marketing manager reviewing aggregate response figures from thirty regions is operating without the personal stake, the local knowledge, and the direct relationship that make small business owners such demanding and effective clients. The solution isn't better reporting from the intermediary chain. It's primary data that reaches the client without passing through the chain at all.
For the full strategic context on how leaflet distribution in 2026 is being reshaped by platform-based accountability - and how the distinction between national reach and national verification is becoming something large clients are able to see and demand - that guide covers the landscape.
Ready to commission a national campaign where the evidence is yours from day one? View campaigns on Marketize - platform-generated GPS verification across all regions, client-direct access to primary coverage data, and regional reporting that shows you the distribution of results rather than the average of them.